


Figure 1 TLRY iron fly on 13 September 2018
Options have infinite combinations but the classic hypothetical risk free trade is the credit spread with a wing width that is smaller than the credit collected. Naysayers will tell you that in this age of algos and massively automation driven trading such pricing differences and arbitrage are polished off immediately. The chart above – however – is a real one and the pricing of the TLRY spreads endured over a fairly extensive period, it seemed in fact a free lunch was available.
Others will argue that spread differences set by market makers make entering (or exiting) such positions at the theoretical profit an impossibility or just extraordinarily rare. This argument too must be rejected. Consider the chart below from a very recent NON OFFICIAL trade on Steady Options in the DJT:
Figure 2 DJT iron fly on 4th April 2024
Although less pronounced than the TLRY example one can see that the mid of this spread traded above 5$ which is the width of the spread – although bid/ask was rather wide there was a considerable amount of trading that occurred above this level. Whilst one might expect to see such differences at deep ITM or OTM levels due to skew, it is unusual but not impossible to find these kind of discrepancies.
Of course ‘haters are gonna hate’; and a chorus of voices will rise up to say that the above examples of mispricing are at once artifacts and on top of that will yield pennies only. Trading and capital costs will get you at best a special discounted menu at Taco Bell and never a proper dinner in the Ritz. That, however, would be untrue as well – options being leveraged instruments have this amazing ability to deliver outsized – infinite even – returns if you are right on direction. Sometimes it doesn’t take a genius to figure out that something is going to zero. The true story of LFIN and its meteoric crash with a business plan that was not far off the one of the South Sea Bubble: a promise of a future venture in crypto. At one point trading over $140 the stock reached a valuation of more than $6B. Correctly called by legions of retail investors on Reddit’s r/wallstreetbets; puts were bought by the bucket load and LFIN was trading near zero 6 months later leaving some traders with credible 5 figure returns and % profits of over 2000%.
Are you convinced yet? If you are you can buy us lunch!
In the article below we will dive into the three trades mentioned and conclude on some learnings aspects from them. Truly, there never is such a thing as a free lunch but that doesn’t mean there isn’t a buck to made if you are careful.
When everybody was getting high
Butterflies are common option instruments and often they are a bit of a toss-up between the net debit you incur in opening them (or the credit) and the width of the spread you have. A wide triangle of profit could be worth the risk of the stock ending under or over (depending on your spread and the side of the butterfly) your strikes. Normally due to call/put parity it is not possible to open a credit spread for more than the width of the strikes, the reason is simple. Market makers (or other market players) could simply buy or short the stock and create an opposite position that would effectively exploit this pricing difference and it would be immediately arbitraged away.
Yet back in 2018 an observant Steady Options member noted that a new stock, TLRY, recently quoted was making a meteoric rise on the market.
Figure 3 logarithmic TLRY stock from 07/2018 to 11/2018
Unsurprisingly this meteoric rise went hand in hand with exploding implied volatility – what’s more the IV differential between calls and puts also became insanely high. Figure 1 had a difference of no less than 70pts between the IV of the ATM call and ATM put. Near the close on Thursday 13th of September 2018 the ATM 5$ wide spread was trading at over 6$ – this was a function of the market closing however but several positions were opened anywhere between 25c to 50c over the width of the wings.
Figure 4 TLRY option spread ATM 13th September 2018 – 10mn before closing
The general presumption was that this mispricing could not endure. This proved to be far from the truth as the next day(s) it became clear that whilst it was possible to open this position – at a credit over the wing width – closing it for the spread width wasn’t working well. It was also noticed that the deeper in the money you would open a spread, the easier it was to do so for a decent credit. A particularly valiant trader opened 950 spreads over a multiple of strikes for such a credit. This wasn’t a trade to make the year – it was the trade to make retirement.
Doubts set in as surely there had to be some hidden flaw which indeed could be read in places that option traders rarely examine: the borrow rate for TLRY.
Figure 5 Borrow rates for TLRY stock on 13th September 2018
As can be seen from the stock price movement in figure 3 TLRY was moving really fast. Within a week you had to pay 20c for 400$ strike calls expiring in October and half a buck for the 50$ put in the same expiry. A 350% borrow rate translates at close to 1% per day or $120 for every ATM spread shown – the position is indeed guaranteed to yield the surplus over the wing width but you have to survive until expiry.
What people started noticing – beginning with ITM calls – was that short calls started getting exercised. This meant that you had multiple choices with tricky outcomes:
Exercise your long call (if ITM) and just risk the stock not dropping to the put level; Borrow the stock and stay short at a cost of 1% per day; Close the whole position at a loss because you cant get a reasonable price for your puts and what’s more exercise happens outside of normal trading hours so the stock could be anywhere when you try this because of additional volatility.A further risk was quickly identified even if you made it to expiry – with a stock moving so much there was a risk that your position would end between the strikes but that after market hours it would move out again effectively locking in your loss without enabling you to cash in on what should have been a positive position. Once again just the weekend cost of carrying a short in your account would wipe out any profits in the best of circumstances.
To say there was no free lunch was an understatement, the trader that opened 950 spreads in fact took on a 27M$ risk when doing so. He lost 4 digit level dollars on just a few spreads that were exercised over a weekend and even then he was lucky as the stock vaulted upwards afterwards. Some others with smaller positions did manage to get out – key was that they did so before expiry neared. The closer to a Friday one came – the more likely it was that ITM calls would be exercised – the chief risk coming from them.
The learning from this trade was not that it was fundamentally wrong but there are several things to be taken into account:
Options mispricing at this level are always an indication of an underlying phenomenon of some kind that is outside of normal stock trading. In this case it was:
The agreement in June 2018 to legalise pot in Canada which was to come into effect mid October; The very recent IPO of TLRY meaning that it had a narrow free float and a lot of limitations; What we would now call ‘meme-like’ euphoria regarding the prospects of pot stocks;
The telling signs that could be deduced from options trading were:
The position was only vulnerable to early exercise which is a characteristic of American style options that are universally used for stock trading. Anyone who was not way ITM came out more or less unscathed from the positions opened but this was very tricky by the time TLRY hit $300 on 09/19/2018. Its hard to give a correct estimate but its likely near 50% of ITM calls with more than a month to go before expiry were exercised. The weekly expiry of 09/21/2018 was exercised overnight from Wednesday to Thursday for even higher percentages. With the stock halving again by that Friday expiry anyone not agile enough would have been caught full in the cross fire.
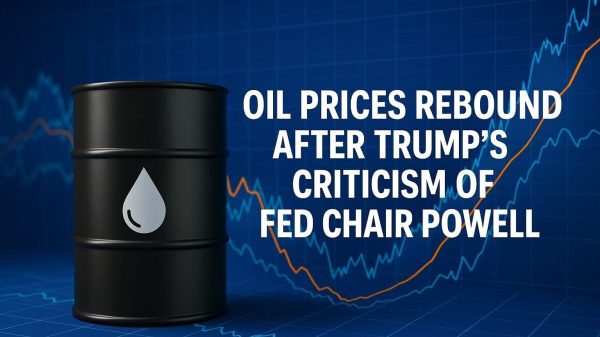
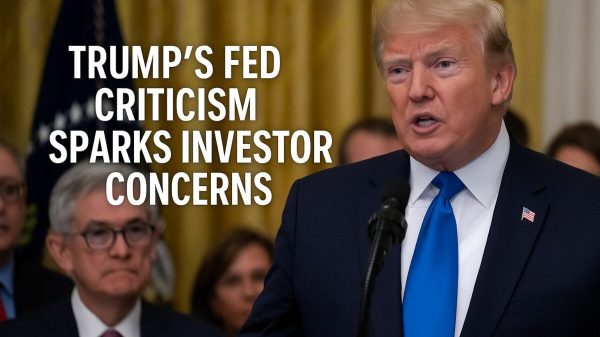
Bill Gross called it: If you are bold you sell premium on DJT
On 29th of March 2024 DJT – the social media company of Donald Trump – launched on the stock market. Like TLRY it was a high visibility launch and the stock was both praised and criticised from the start. New Jersey businessman Mike Crispi embodied the bullish sentiment best:
Noone would want to deny Mike his day in the sun but a more interesting quote came from Bond King Bill Gross who stated that “A genius can have a high IQ or invest in the stock market during a bull market. A genius can also be an investor with the courage to sell DJT options at a 250 annualized volatility,”. It turned out that Bill’s position likely had a lot of similarity to a credit spread like an iron fly or condor because Yahoo Finance found that:
Figure 6 Source Yahoo Finance/Reuters
DJT had huge volatility skew between puts and calls
Monthly options expiring in about 2 weeks had the ATM put 2.4 times more expensive than the ATM call. This large skew up a feasible arbitrage scenario. For example, with the stock ~$47.5, the 47.5/42.5 call and put credit spreads should cancel each other out and make this a basically guaranteed break-even trade. But in this extreme volatility skew, this combination of put and call credit spreads could be opened for a credit quite a bit over the $5.00 wing width (and the amount over the wing width would be a guaranteed gain at expiration). On April 4, the following trade was opened using the April 19 expiration, it’s called a Box combo. Note how the ATM 47.5 strike put is so much more expensive than the 47.5 call, and the 42.5 call is close in value to the 42.5 put even though the call is around $5.00 ITM and the put is OTM.
This trade yielded a $5.65 credit on a box combo with a wing width of $5.00 (so the opening credit was 13% above the wing width). This means that at expiration, letting any ITM legs go through assignment you’d wind up with a $65 profit at all stock price points.
But are there any potential pitfalls with this trade? The answer is yes, and it’s all due to the early assignment possibility with American style options. The extreme put vs call volatility skew that enabled this trade to be opened for a credit 13% higher than the wing width also created a trade which is delta negative prior to expiration. Here is the PNL chart at trade opening:
Note how the thick blue line, which represents the profit at expiration, is $65 at all stock price points. However, the thin wavy line is the current status which shows a delta negative trade where the position’s PnL improves if the stock price drops but shows a loss if the stock price rises (this is because in this scenario the OTM put credit spread holds onto much of its value because the put IV is so much higher than the call IV). But why does this matter if a profit is guaranteed if you hold the trade until expiration?
If the stock price rises enough to make the short 42.5 call have only a few cents of extrinsic value (time value) then there is a high probability of getting assigned on the short call. In this case you’d have to close the call side for at or near the $5.00 wing width and hold onto the put credit spread and hope the stock price stays above 47.5 until expiration so the put side expires worthless. There would be quite a bit of risk here as the stock price could very easily make a large downward move with such a high volatility stock. If the stock price were to make a significant decline after closing the call credit spread for near $5.00, you could wind up having to close the put credit spread at a higher price and wind up with a losing trade.
In this particular trade, the stock price dropped (it moved in the right direction for this trade). On April 15 (4 days prior to expiration) with the stock price under $30, it was able to be closed for a debit slightly under $5.00 thereby generating a gain of just over $65. However, had the stock price risen by a few dollars after the trade was opened it would have turned into a much more difficult trade to manage. In the end, it did turn out to be a free lunch trade – but only because the stock price cooperated and moved in the correct direction.
The lead balloon that was LFIN
One of options many pleasant aspects is that you can express a view on the market without betting the farm and yet with potentially infinite returns. For comedic value there is no replacement for the story of the option traders and crypto pioneer LFIN (though RIVN and their criticism by Hindenburg Research come a close second). Once again the mispricing that traders took advantage of and later suffered their utter discomfiture on, was based on events that rarely affect ‘normal stocks’:
A meme-like enthusiasm for this new thing called crypto(?!?); A stock market launch ostensibly backed by NASDAQ’s strict rules that placed a stock with very limited (in fact insufficient) free float on the market; The announcement of the ‘master stroke’ investment in an allegedly successful (but in fact nascent) crypto platform; An extraordinarily rare dropping of the ball by FTSE Russel Index managers that co-opted the stock into their index without respecting their own rules.
All these elements put together boosted the stock from 5$ to over 140$ (intraday) and billions in stock market valuation. A critical issue was that the amount of stock required for the index funds was over half the alleged (inflated) free float. So a bona fide short squeeze occurred and everybody started talking about LFIN as if they knew what these guys were doing.
As the madness hit its peak, the CEO Venkata Meenavalli went on CNBC where every average Joe could follow the live train crash. As the interview progressed, LFIN’s price dropped some 16% in after-hours trading, with CNBC helpfully displaying this sharp downward trend in a chart next to Meenavalli’s face. If you ever did a presentation and thought your point did not come across, think of Venkata and you won’t think so poorly of yourself.
Figure 7 LFIN CEO interview on CNBC 18th December 2017, with live AMC prices as he speaks
A few classic statements were:
A: We own 140 bitcoins (one coin was worth about 10k); ‘We are a profitable company.’ And also ‘We are a GEICO of this world.’ ‘We have a team of quants.’ Q:’Is the 6B$ market valuation absurd?’
A:’Yes.’ No less than 11 times he repeated: ‘You have to understand that…’ followed by some unintelligible remark.
Needless to say the option traders piled in and the put buyers were seemingly quid’s in. Reddit fora were full of retail traders having positions between 10-100s of put options at strikes varying from 50$ to 2.50$. Here’s what happened with LFIN:
The insanity of this chart cannot be overestimated, LFIN had listed for 5$ on 15th December 2017 and hit 142$ (closing at $72.38) on December 18th 2017 when the CEO made his ill-fated interview. If ever there was a reason to buy puts on a company the whole sorry interview as well as multiple discoveries by i.a. Citron Research made it 100% plain this company was one big scam. Throughout late December and January people bought puts and they were cheap at the price. The vast majority chose expiries in April and May. As March came around the bells of doom sounded louder and louder for LFIN, not only was there an SEC investigation but FTSE Russel reversed its decision to include them in their index and multiple other agency lawsuits and NASDAQ investigations were triggered. Within the space of a few days the stock went from respectable to being at risk of delisting.
A T12 notice was issued end of March and this effectively delisted the stock. Now a trifecta of disasters faced put holders – some with deep ITM positions opened for 5$ at the 50$ strike for the April expiry:
Institutional holders which had bought 45% of the theoretical free float had not finished unloading all their stock. With the halted trading they could no longer offload them; The CEO turned out to have lied about the free float in general and the NASDAQ stopped 26M shares from being circulated in violation of a lock-up; Short sellers and put holders held 250%+ of the free float – a kind of inverse short squeeze.Having taken millions of dollars in losses institutional holders realising the dearth of shares increased borrowing costs to 3000%. Simultaneously option holders – if they were lucky – had to exercise their puts and pray that trading would resume so they could fill their short positions thus created. Ominously no T12 trading halt had – up to that point – ever been lifted in less than 3 months. This would place all of the April, May and June put option holders in a dilemma.
For one they were required to put up the full sum of the value of the shares they had exercised puts against. This was very hard for any call holders that happened to be long strikes around the money or had sold credit spreads. Put holders likewise had to exercise and pay the extortionate borrow fees of 250$+ a day without knowing when they could cover the short. In the end trading OTC resumed on 05/28/2018 but it took another month before the stock traded below 5$ let alone near zero. This meant that anyone that had gambled and exercised 2.50$ strike puts were out of luck.
The general tenure in the reports of the retail traders about their experience is that even the ones that made 5 figures in the initial phase of the collapse, had doubled down so far after collecting their winnings that they were now out 6 figures. As the owner of this website famously wrote – position sizing is essential for successful trading.
What shall we have for lunch?
The stock market wisdoms that ‘there is no such thing as a free lunch’, ‘the market can stay irrational longer than you can stay liquid’ and so forth exist for a reason. Mispricing in options and opportunity for arbitrage exist – the above examples show that this occurs primarily in unusual situations where you have to take into account risks which do not exist when you trade established and liquid stocks. Black swan events like trading halts and their consequences are rarely understood until you are confronted with them.
Should you therefore shy away from trading these opportunities? Of course not, where is the fun in that?
However you should take into account that these trades are risky and size your position accordingly. Be prepared also to take a quick buck rather than wait for your ship to come in. if you are tempted to make a YOLO trade, remember the warning tale of the ‘Man who couldn’t lose’. It was a short tale of a man that always won in casinos, on his deathbed when asked what his secret was, his answer was simple: ‘Observe the room until you find the guy that is about to lose everything, the house, the car, the wife, the kids on his last gamble. Then bet against him, because that guy ALWAYS loses.’ So it is with any YOLO or retirement trade, you will surely fail whereas if you were less greedy you could have joined us for lunch at Taco Bell.
Many thanks to our contributors @TrustyJules and @Yowster for this fascinating article.