


Traders will often refer to their equity curve, and use different expressions when describing it, like climbing, smooth, dipping, or even underwater.
But what is it and how do traders use their equity curve to help their trading?
Simply put, an equity curve is a graphical representation of the value of a trading account as it changes over time.
It is usually plotted as a line graph, with the x-axis showing the time elapsed or the number of trades, and the y-axis showing the account value.
Looking at a trading strategy’s equity curve gives us a quick view of the positive or negative expectancy of that strategy over time. A upward sloping curve (even with dips along the way) shows a profitable strategy, while a downward sloping curve (even with peaks along the way) shows a losing strategy.
Equity Curve Example
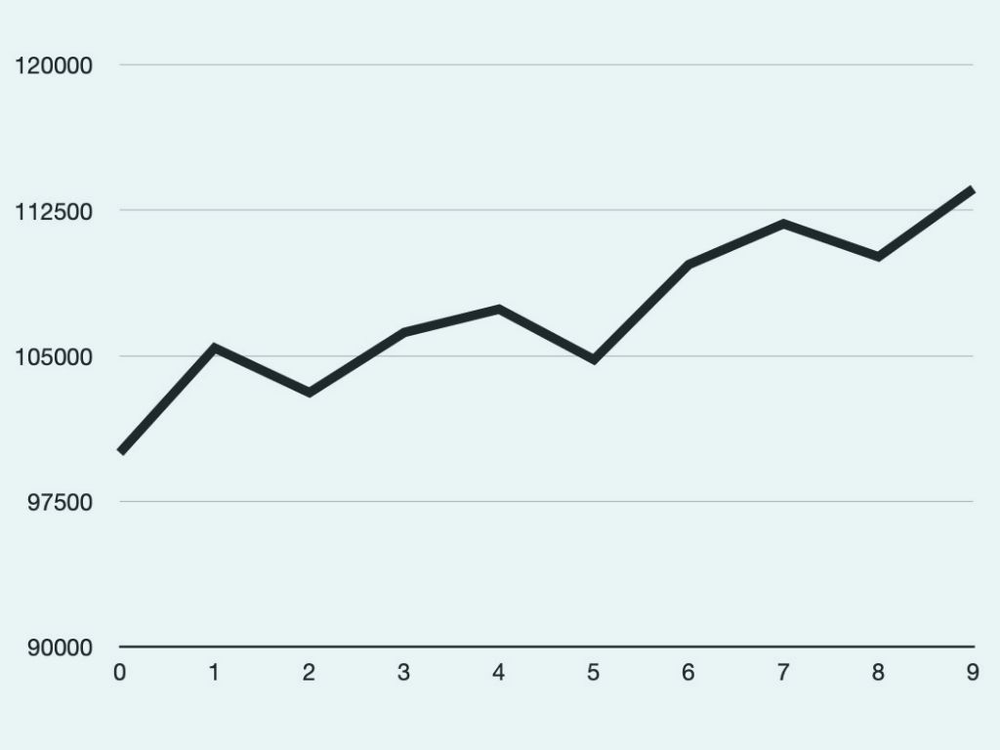
A trader has a starting capital of 100,000 (in whatever currency) and makes 9 trades over a period of time. Some are winners and some are losers, but their effect on the trader’s total account balance can be recorded as follows:
If the changing account balance is then plotted on a line graph, with number of trades on the x-axis and account balance on the y-axis, the trader’s equity curve over those particular 9 trades can be represented visually as follows:
Things to be aware of when checking a trader’s equity curve
Equity curves can be used by traders to show others how their trading strategy is performing. Traders often just highlight the fact that the upward trajectory means the strategy is profitable, but there are a number of things to be aware of.
It is always worth checking that the scales used are correct and they have not been manipulated to make the curve look better than it is. This is especially true of the y-axis showing account value.
In the same vein, it is easy for a trader to just focus on one part of their equity curve e.g. the best performing trading period. Their strategy might only work well in certain market conditions, but not in others, so it is best to check the equity curve over a large number of trades and a long period of time.
Also, beware of any long periods of drawdown i.e. big dips. While it is easy to focus on the bigger, longer-term picture when looking at an equity curve, while money is on the line, those big dips will be very difficult to deal with ,psychologically.
Simulated Equity Curves
It is very useful to simulate different equity curves to fully understand the effects of different risk:reward ratios and win probabilities on strategy profitability.
For example ,this equity curve simulator can give us projected curves when we change different variables. Here is a predicted curve with a risk:reward of 1:2 and a win probability of 50%:
And here is the equity curve with the same risk:reward but a win probability of 30%. As you can see, there is a small chance that over 100 trades, this account could be profitable, but ,statistically, it would most likely produce a negative equity curve.
Equity curve simulators are useful for traders in that they can instil confidence that a strategy has a likelihood of being profitable in the long-term. This can be useful if a strategy has proved to have a good risk:reward ratio and win probability in the past, and is going through a temporary drawdown.
Conversely, there is a danger of assuming a strategy will be profitable just because the theoretical equity curve is positive. This is a downside of studying theoretical equity curves, as they give no idea of the psychological impact of living that curve in real time.
However, equity curves continue to be incredibly useful to traders looking for a simple representation of any given trading strategy over time.